Variance of a random variable
Variance of a random variable
Take a random variable \(X\) (either continuous or discrete). Assume that the expectation is some number:
The variance \(\mathbf{V}[X]\) of \(X\) is defined as the expectation of the squared difference of \(X\) from the expected value (or the mean) \(\mu\), i.e.,
You can think of the variance as the measure of the spread of the random variable around its expected value. See Fig. 11 for a visualization.
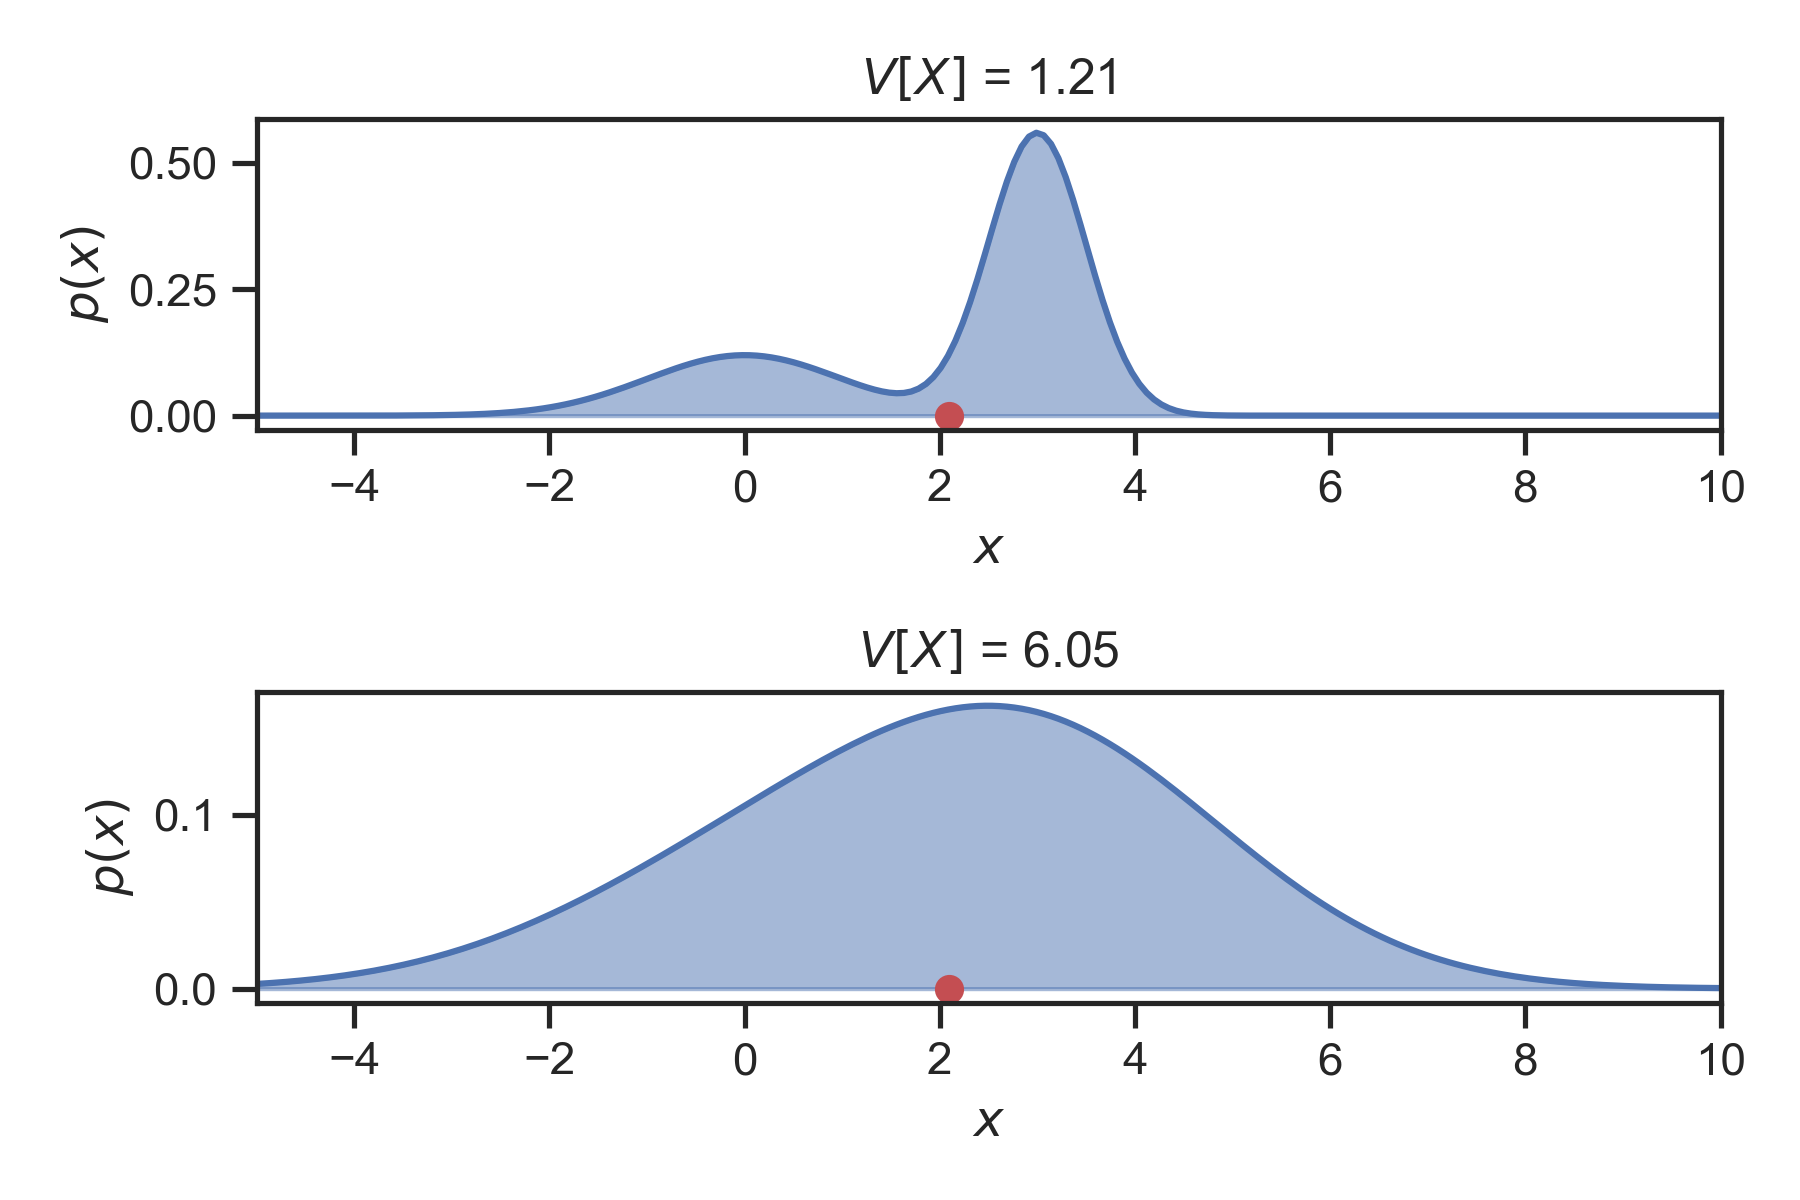
Fig. 11 Comparison of the variance of two arbitrary random variables. We show the PDF of the random variables (blue shaded area) and the expectation (red dot). The variance for each case is on the title of the each subplot. The random variable at the bottom has six times the variance of the one on the top.
The variance is always positive. If \(X\) has units, then the variance of \(X\) has these units squared. For example, if \(X\) is in meters, then \(\mathbf{V}[X]\) is in meters squared. Very often, instead of the variance we use the standard deviation of a random variable. The standard deviation is defined to by the square root of the variance:
The standard deviation is more convenient because it has the same units as \(X\). But its intuitive meaning is the same.